Statistics and analyses on Energy Performance Certification of Buildings in Brussels.
You will find on this page statistics and their analyses obtained from a sample of 2,631 residential EPB / EPC certificates issued between May 2011 and January 2026 by CertiBru SRL in the Brussels Capital Region.
The purpose of these statistics is to better understand Energy Performance Certification of Buildings.
For sellers, to be able to anticipate and assess the results for their house or apartment.
For prospective buyers or tenants, to be able to evaluate and compare their future acquisition more objectively.
The results of EPC Certificates vary greatly between types of housings (house, apartment, year of construction, type of heating, presence of insulation...). One may love the charm of a 1900s house or seek a highly energy-efficient dwelling. These two orientations are often incompatible.
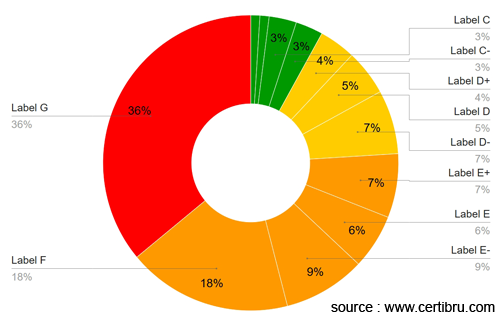
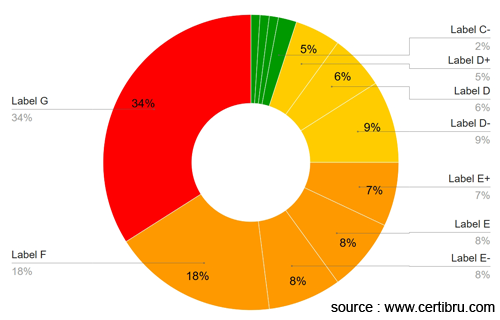
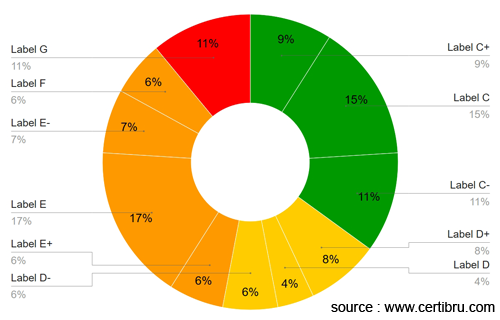
Distribution by energy class
of all EPC certificates
| EPC Label | EPC Label | ||
|---|---|---|---|
| A++ | 0 % | C- | 3 % |
| A+ | 0 % | D+ | 4 % |
| A | 0 % | D | 5 % |
| A- | 0 % | D- | 7 % |
| B+ | 0 % | E+ | 7 % |
| B | 0 % | E | 6 % |
| B- | 1 % | E- | 9 % |
| C+ | 1 % | F | 18 % |
| C | 3 % | G | 36 % |
No residential EPC certificate issued to date in Brussels by CertiBru SRL has obtained a label: A++, A+, A, A-, B+, or B. This is why these labels do not appear in the chart. Only EPC certificates with labels: B-, C, C+, C, C-, D+, D, D-, E+, E, E-, F, and G are present.
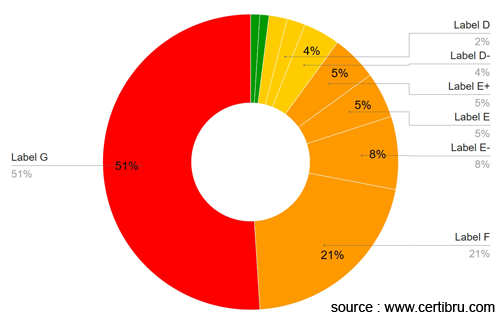
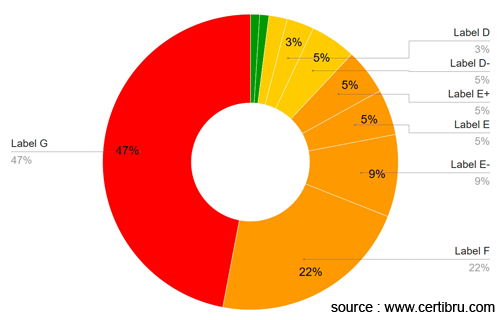
Distribution by energy class
of all certified houses
| EPC Label | EPC Label | ||
|---|---|---|---|
| A++ | 0 % | C- | 1 % |
| A+ | 0 % | D+ | 2 % |
| A | 0 % | D | 2 % |
| A- | 0 % | D- | 4 % |
| B+ | 0 % | E+ | 5 % |
| B | 0 % | E | 5 % |
| B- | 0 % | E- | 8 % |
| C+ | 1 % | F | 21 % |
| C | 0 % | G | 51 % |
This chart illustrates the distribution of the different energy categories for all the single-family houses we have certified.
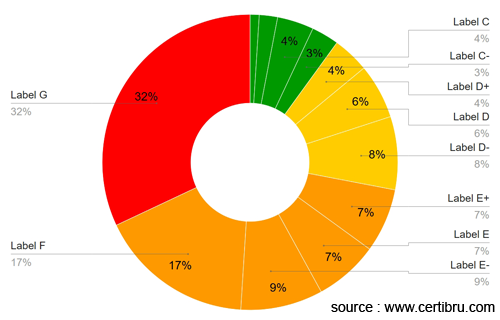
Distribution by energy class
of all certified apartments
| EPC Label | EPC Label | ||
|---|---|---|---|
| A++ | 0 % | C- | 3 % |
| A+ | 0 % | D+ | 4 % |
| A | 0 % | D | 6 % |
| A- | 0 % | D- | 8 % |
| B+ | 0 % | E+ | 7 % |
| B | 0 % | E | 7 % |
| B- | 1 % | E- | 9 % |
| C+ | 2 % | F | 17 % |
| C | 4 % | G | 32 % |
This chart presents the distribution of the different energy categories for all the apartments we have certified.
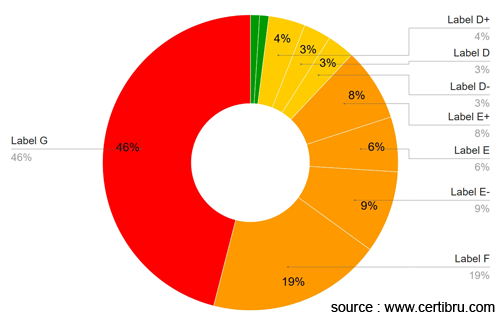
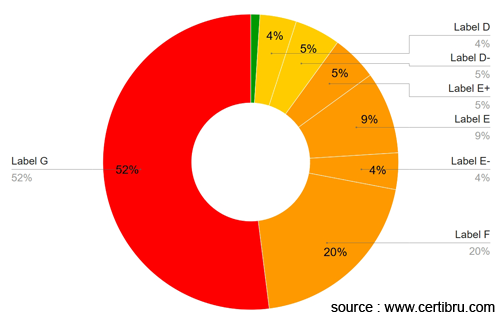
Distribution by energy class
of apartments with a floor as a heat loss wall
| EPC Label | EPC Label | ||
|---|---|---|---|
| A++ | 0 % | C- | 1 % |
| A+ | 0 % | D+ | 4 % |
| A | 0 % | D | 3 % |
| A- | 0 % | D- | 3 % |
| B+ | 0 % | E+ | 8 % |
| B | 0 % | E | 6 % |
| B- | 0 % | E- | 9 % |
| C+ | 0 % | F | 19 % |
| C | 1 % | G | 46 % |
This chart presents the distribution of energy classes for apartments with a floor as a heat loss wall.
This group of apartments, most often located on the ground floor, may have a floor in contact with the ground, a cellar, a parking area, or the outside.
It can be seen that this group of apartments is penalised compared to all certified apartments.
Distribution by energy class
of apartments with a roof as a heat loss wall
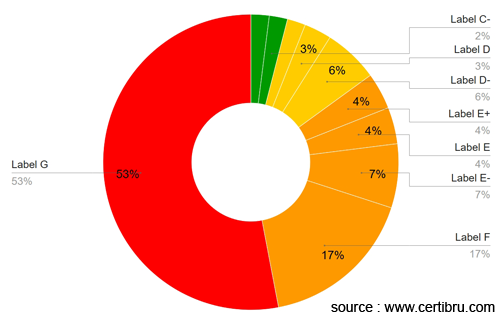
| EPC Label | EPC Label | ||
|---|---|---|---|
| A++ | 0 % | C- | 2 % |
| A+ | 0 % | D+ | 2 % |
| A | 0 % | D | 3 % |
| A- | 0 % | D- | 6 % |
| B+ | 0 % | E+ | 4 % |
| B | 0 % | E | 4 % |
| B- | 0 % | E- | 7 % |
| C+ | 0 % | F | 17 % |
| C | 2 % | G | 53 % |
This chart refers to the energy class of apartments with a roof as a heat loss wall.
Some apartments may have a roof even without being on the top floor, in cases where the apartment above has, for example, a terrace.
The roof does not necessarily extend over the entire surface of the apartment.
It can be seen that this type of apartment is penalised compared to all certified apartments.
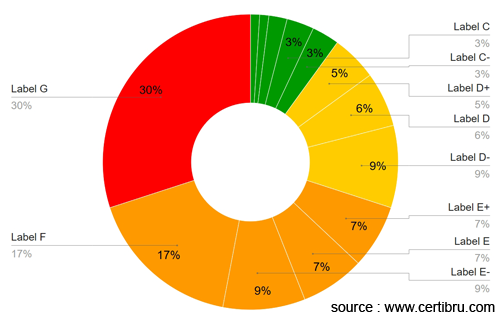
Distribution by energy class
of apartments equipped with individual heating
| EPC Label | EPC Label | ||
|---|---|---|---|
| A++ | 0 % | C- | 4 % |
| A+ | 0 % | D+ | 4 % |
| A | 0 % | D | 5 % |
| A- | 0 % | D- | 6 % |
| B+ | 0 % | E+ | 8 % |
| B | 0 % | E | 7 % |
| B- | 0 % | E- | 8 % |
| C+ | 2 % | F | 18 % |
| C | 5 % | G | 33 % |
This chart distributes the energy classes of all apartments equipped with individual heating.
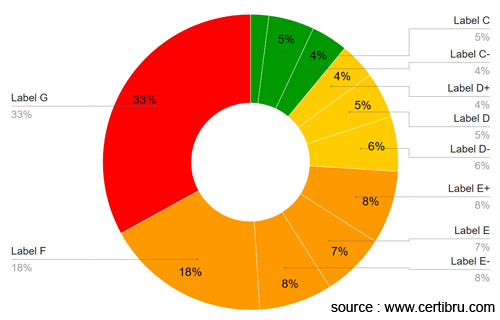
Distribution by energy class
of apartments equipped with collective heating
| EPC Label | EPC Label | ||
|---|---|---|---|
| A++ | 0 % | C- | 3 % |
| A+ | 0 % | D+ | 5 % |
| A | 0 % | D | 6 % |
| A- | 0 % | D- | 9 % |
| B+ | 0 % | E+ | 7 % |
| B | 1 % | E | 7 % |
| B- | 1 % | E- | 9 % |
| C+ | 2 % | F | 17 % |
| C | 3 % | G | 30 % |
This chart distributes the energy classes of all apartments equipped with collective heating.
Distribution by energy class
of housings equipped with electric heating
| EPC Label | EPC Label | ||
|---|---|---|---|
| A++ | 0 % | C- | 1 % |
| A+ | 0 % | D+ | 0 % |
| A | 0 % | D | 4 % |
| A- | 0 % | D- | 5 % |
| B+ | 0 % | E+ | 5 % |
| B | 0 % | E | 9 % |
| B- | 0 % | E- | 4 % |
| C+ | 0 % | F | 20 % |
| C | 0 % | G | 52 % |
Electric heating: The EPC standard considers that electrical energy requires 2.5 times more primary energy to produce the same amount of energy as gas or oil heating. This is why housings (houses or apartments) using electric heating start with a significant disadvantage (even if these housings are equipped with modern electric heating systems with storage and regulation probes).
Distribution by energy class
of housings equipped with solar panels or cogeneration

| EPC Label | EPC Label | ||
|---|---|---|---|
| A++ | 0 % | C- | 17 % |
| A+ | 0 % | D+ | 4 % |
| A | 0 % | D | 4 % |
| A- | 0 % | D- | 4 % |
| B+ | 0 % | E+ | 0 % |
| B | 8 % | E | 4 % |
| B- | 17 % | E- | 4 % |
| C+ | 21 % | F | 0 % |
| C | 17 % | G | 0 % |
This table represents houses or apartments equipped with photovoltaic panels, thermal solar panels, or a cogeneration system.
Distribution by energy class
of housings built before 1945
| EPC Label | EPC Label | ||
|---|---|---|---|
| A++ | 0 % | C- | 1 % |
| A+ | 0 % | D+ | 2 % |
| A | 0 % | D | 3 % |
| A- | 0 % | D- | 5 % |
| B+ | 0 % | E+ | 5 % |
| B | 0 % | E | 5 % |
| B- | 0 % | E- | 9 % |
| C+ | 0 % | F | 22 % |
| C | 1 % | G | 47 % |
This chart represents the distribution of energy classes for housings (apartment or single-family house) built before 1945.
Distribution by energy class
of housings built between 1946 and 1970
| EPC Label | EPC Label | ||
|---|---|---|---|
| A++ | 0 % | C- | 2 % |
| A+ | 0 % | D+ | 5 % |
| A | 0 % | D | 6 % |
| A- | 0 % | D- | 9 % |
| B+ | 0 % | E+ | 7 % |
| B | 0 % | E | 8 % |
| B- | 1 % | E- | 8 % |
| C+ | 1 % | F | 18 % |
| C | 1 % | G | 34 % |
This chart represents the distribution of energy classes for housings (apartment or single-family house) built between 1946 and 1970.
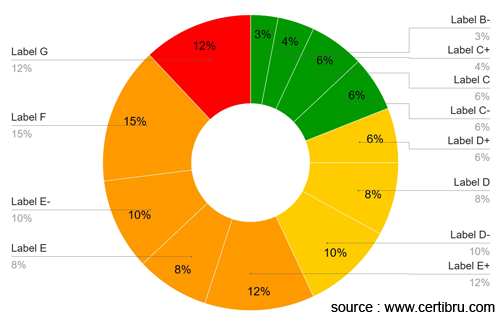
Distribution by energy class
of housings built between 1971 and 1985
| EPC Label | EPC Label | ||
|---|---|---|---|
| A++ | 0 % | C- | 6 % |
| A+ | 0 % | D+ | 6 % |
| A | 0 % | D | 8 % |
| A- | 0 % | D- | 10 % |
| B+ | 0 % | E+ | 12 % |
| B | 0 % | E | 8 % |
| B- | 3 % | E- | 10 % |
| C+ | 4 % | F | 15 % |
| C | 6 % | G | 12 % |
This chart represents the distribution of energy classes for housings (apartment or single-family house) built between 1971 and 1985.
Distribution by energy class
of housings built between 1986 and 1995
| EPC Label | EPC Label | ||
|---|---|---|---|
| A++ | 0 % | C- | 14 % |
| A+ | 0 % | D+ | 8 % |
| A | 0 % | D | 12 % |
| A- | 0 % | D- | 5 % |
| B+ | 0 % | E+ | 10 % |
| B | 0 % | E | 6 % |
| B- | 0 % | E- | 6 % |
| C+ | 5 % | F | 8 % |
| C | 13 % | G | 13 % |
This chart represents the distribution of energy classes for housings (apartment or single-family house) built between 1986 and 1995.
Distribution by energy class
of housings built between 1996 and 2000
| EPC Label | EPC Label | ||
|---|---|---|---|
| A++ | 0 % | C- | 11 % |
| A+ | 0 % | D+ | 8 % |
| A | 0 % | D | 4 % |
| A- | 0 % | D- | 6 % |
| B+ | 0 % | E+ | 6 % |
| B | 0 % | E | 17 % |
| B- | 0 % | E- | 7 % |
| C+ | 9 % | F | 6 % |
| C | 15 % | G | 11 % |
This chart represents the distribution of energy classes for housings (apartment or single-family house) built between 1996 and 2000.
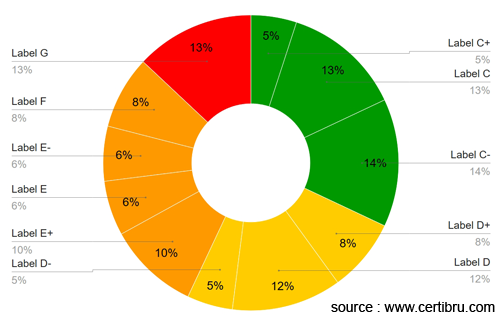
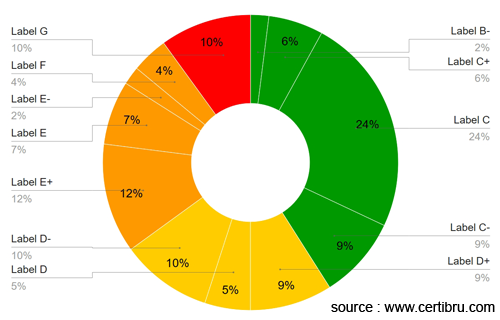
Distribution by energy class
of housings built between 2001 and 2005
| EPC Label | EPC Label | ||
|---|---|---|---|
| A++ | 0 % | C- | 9 % |
| A+ | 0 % | D+ | 9 % |
| A | 0 % | D | 5 % |
| A- | 0 % | D- | 10 % |
| B+ | 0 % | E+ | 12 % |
| B | 0 % | E | 7 % |
| B- | 2 % | E- | 2 % |
| C+ | 6 % | F | 4 % |
| C | 24 % | G | 10 % |
This chart represents the distribution of energy classes for housings (apartment or single-family house) built between 2001 and 2005.
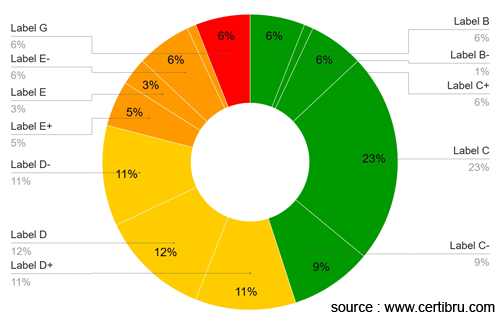
Distribution by energy class
of housings built between 2006 and 2010
| EPC Label | EPC Label | ||
|---|---|---|---|
| A++ | 0 % | C- | 9 % |
| A+ | 0 % | D+ | 11 % |
| A | 0 % | D | 12 % |
| A- | 0 % | D- | 11 % |
| B+ | 0 % | E+ | 5 % |
| B | 6 % | E | 3 % |
| B- | 1 % | E- | 6 % |
| C+ | 6 % | F | 1 % |
| C | 23 % | G | 6 % |
This chart represents the distribution of energy classes for housings (apartment or single-family house) built between 2006 and 2010.
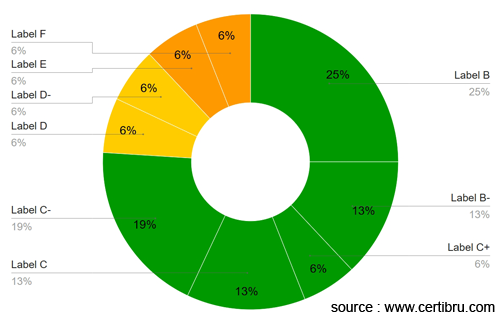
Distribution by energy class
of housings built from 2011 onwards
| EPC Label | EPC Label | ||
|---|---|---|---|
| A++ | 0 % | C- | 19 % |
| A+ | 0 % | D+ | 0 % |
| A | 0 % | D | 6 % |
| A- | 0 % | D- | 6 % |
| B+ | 0 % | E+ | 0 % |
| B | 25 % | E | 6 % |
| B- | 13 % | E- | 0 % |
| C+ | 6 % | F | 6 % |
| C | 13 % | G | 0 % |
This chart represents the distribution of energy classes for housings (apartment or single-family house) built from 2011 onwards.
Summary of statistics and feedback from EPC certifiers
- 36% of all EPC certificates issued are in category G.
- Label calculations are based on current residential construction standards. It is therefore difficult to match these standards if you have a house or apartment that is more than 40 years old.
- Insulation of houses and apartments emerged during the first oil crisis (1973). It was from that point on that energy performance improvements in dwellings began.
- Rroof insulation can significantly improve the performance of a property.
- A ground-floor or top-floor apartment has more heat loss areas (floor, ceiling) than an apartment located between two floors.
- For an apartment, the use of a collective heating system or an individual boiler has no influence on the EPC certificate result.
- Even if window frames or glazing have been replaced, it is entirely normal that a house or apartment built before 1945 can barely (without roof and wall insulation work) achieve more than G or F on the energy class scale established for EPC certification in the Brussels Capital Region.
Additional information
- The consumption of city water is not included in the EPB certificate, nor is the equipment for recovering rainwater.
- A heat loss wall is a surface (floor, wall, ceiling, or roof) that is in contact with an unheated part of the dwelling (e.g. the outside, a cellar, a parking area...). By default, the EPC certification protocol considers that common areas in apartment buildings and party walls are always heated.
- The number of external facades of a dwelling greatly influences the EPC certification result. For example, a house with 3 external facades consumes more energy than a house with only 2 facades (semi-detached). Extensions are also a source of additional heat loss.


